Thoughts on Repetition Speed and Force Velocity Curve
05/23/1913:37
My thoughts on repetition speed, and force-velocity curve from muscle physiology.
Almost all of the mathematical calculations by engineers concerning repetition speed during resistance training makes several assumptions, looking at the below hand drawn image of a repetition schematic:
Almost all of the mathematical calculations by engineers concerning repetition speed during resistance training makes several assumptions, looking at the below hand drawn image of a repetition schematic:
My thoughts on repetition speed, and force-velocity curve from muscle physiology.
Almost all of the mathematical calculations by engineers concerning repetition speed during resistance training makes several assumptions, looking at the below hand drawn image of a repetition schematic:
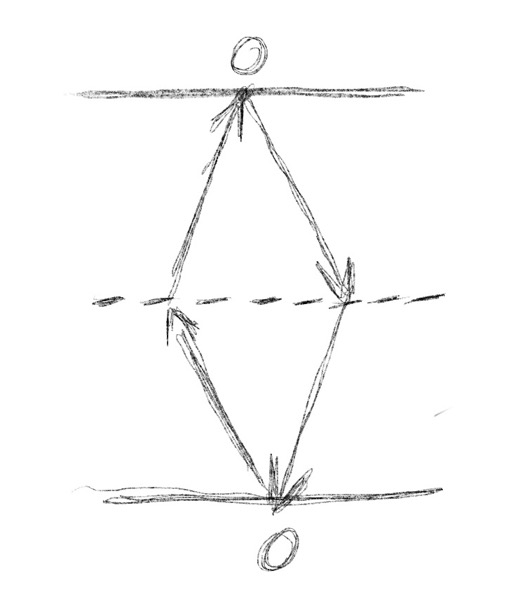
1. Assumes a starting speed of zero degrees per second. (Yes, this is true.)
2. Assumes a smooth and continuous constant rate of acceleration during the concentric phase to the midrange of the repetition, dashed horizontal line. (This is not necessarily true, especially considering the form of most trainees.)
3. Assumes a smooth and continuous constant rate of deceleration to the upper turnaround, until zero degrees per second is reached. (This is not necessarily true, especially considering the form of most trainees.)
4. Assumes a smooth and continuous constant rate of acceleration during the eccentric phase to the midrange of the repetition. (This is not necessarily true, especially considering the form of most trainees.)
5. Assumes a smooth and continuous constant rate of deceleration from the midrange of the repetition to the lower turnaround. (This is not necessarily true, especially considering the form of most trainees.)
6. Repeat the process until the subject reaches volitional fatigue.
Notice that steps 2-5 are not necessarily true, considering the way most subjects train.
Consider the following hand drawn image:
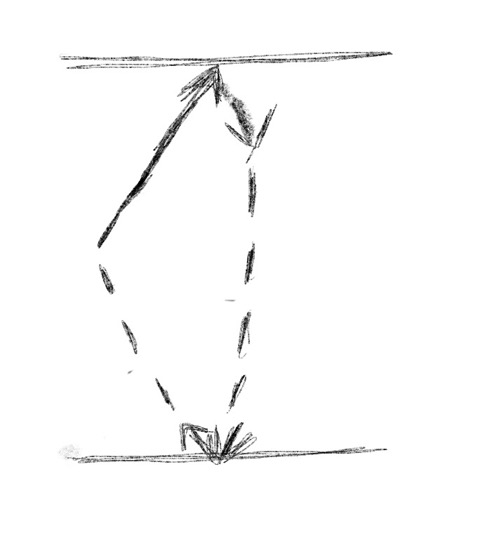
Most subjects pop or jerk the initial phase of the concentric, adding significant momentum to the movement. This will result in increased acceleration during the initial phase of the concentric, and unload the targeted musculature. While the musculature is temporarily unloaded, sarcomere shortening velocity will increase due to less force required (force-velocity curve from muscle physiology). This is something that confuses many people concerning the force-velocity curve. The force-velocity curve refers to sarcomere shorting velocity, not bar speed or apparatus speed, due to increased momentum.
As the concentric phase of the movement proceeds to the midrange position or past the midrange position, depending on the amount of momentum used, bar speed will slow as the momentum is decreased and the musculature catches up to the weight. Sarcomere shortening velocity may slow as the musculature may become partially loaded. When observing the form most people use when training, it is not unusual for them to nearly drop the weight during the eccentric phase of the movement, again unloading the musculature.
When the bottom of the eccentric phase is reached (lower turnaround), typical trainees may use the elasticity of the tissues (as in a barbell curl or squat), bounce the bar off the chest (as in a bench press), or bounce the weight off the floor (as in a deadlift). All of this results in further momentum and unloading of the musculature throughout parts of the range of motion. Further, significant changes in torque, especially the amount of torque applied to the soft tissues (muscles, tendons, etc.), may vary massively due to the length of the torque arm and other form discrepancies such as body sway, etc. In a barbel biceps curl for example, the torque experienced by the tendon and other soft tissues, even in a controlled movement, will be a multiple of the weight being lifted times the perpendicular distance between the weight load and elbow.
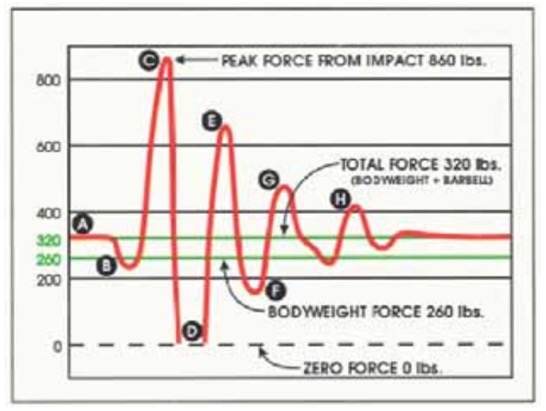
The MedX force plate experiments show this to some degree.
http://www.arthurjonesexercise.com/TheLumbarSpine/TheLumbarSpine.html
The first graph shows a 260 lbs. man standing motionless on a force plate, while holding a 60 lbs barbell. The measured force is 320 lbs (260+60).
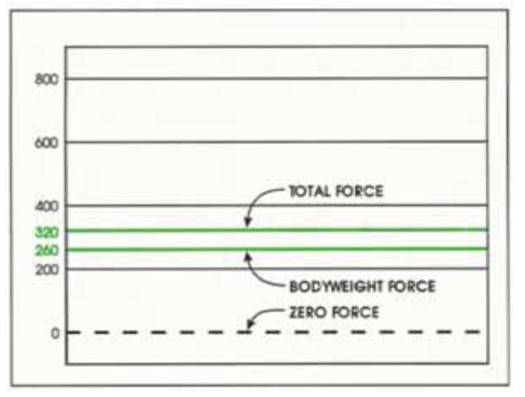
The second graph shows this same man lifting the 60 lbs barbell slowly with control. The force as measured by the plate varies very little around the 320 lbs mark.
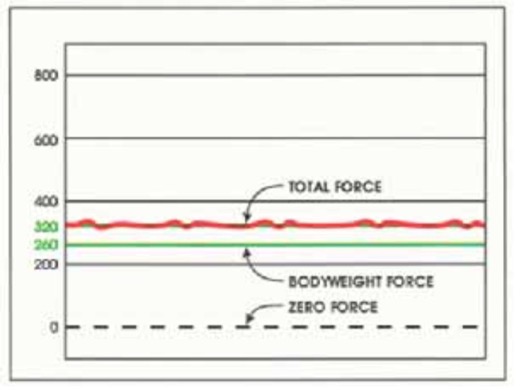
The third graphs shows this same man lifting the 60lbs barbell ballistically. The force varies wildly with this lifting form, sometimes to very dangerous levels. It’s almost difficult to imagine the amount of force on the soft tissues, due to multiplication by the length of the lever arm.
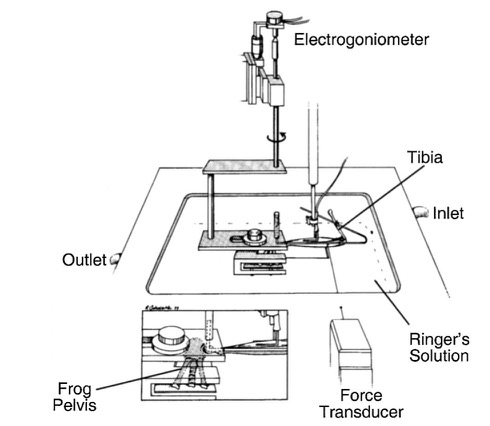
As an addendum, I am including a schematic of the laboratory setup most of the experiments originally examining the force velocity and length tension curves. Those earlier experiments used either intact or isolated frog or mouse muscle, with a video camera measuring sarcomere shorting velocity or tension at various lengths, not apparatus speed.
Muscle, joint, and tendon contributions to the torque profile of frog hip joint.
Richard L. Lieber, Syndey ShoemakerPublished in The American journal of physiology 1992
DOI:10.1152/ajpregu.1992.263.3.R586
Thus if a heavy load is lifted, in a controlled manner with reduced momentum, sarcomere shortening velocity will be slow.
I am quoting from Lieber. Given a sufficiently heavy load, muscle (my words), “force drops off rapidly as velocity increases. For example, in a muscle that is shortening at only 1% of its maximum contraction velocity (extremely slow), tension drops by 5% relative to maximum isometric tension. Similarly, as contraction velocity increases to only 10% maximum (easily attainable physiologically), muscle force drops by 35%! Note that even when muscle force is only 50% maximum, muscle velocity is only 17% Vmax. The take-home lesson is that as a muscle is allowed to shorten (faster – my words), force drops precipitously.”
“It has been determined that the cross-bridges between actin and myosin attach at a certain rate and detach at a certain rate… At any point in time, the cross-bridges generated by a muscle depends on the number of cross-bridges attached. Because it takes a certain amount of time for the cross-bridges to attach (based on the rate of constant attachment), as filaments slide past one another faster and faster (i.e., as the muscle shortens with increasing velocity), force decreases due to the lower number of cross-bridges attached. Conversely, as the relative filament velocity decreases (i.e., muscle velocity decreases), more cross-bridges have time to attach and generate more force, and thus force increases.”
Ryan
blog comments powered by Disqus